
What unites us as civil servants is our motivation to serve the public and make a difference. In a modern digital age, as we strive to be an open, capable and responsive organisation, accountable to the communities we serve, we are also challenging not just what we do but how we do it. We are seeking to co-produce policy and delivery solutions with those most affected by them – 'working with' not 'doing to’.
The team behind the Scottish Index of Multiple Deprivation (SIMD) has responded to this challenge, transforming their statistics to become more accessible, transparent, relevant and useful to the very communities their data describes. I was delighted to see this work recognised at the recent Civil Service Awards, where the team won the award for Use of Evidence.

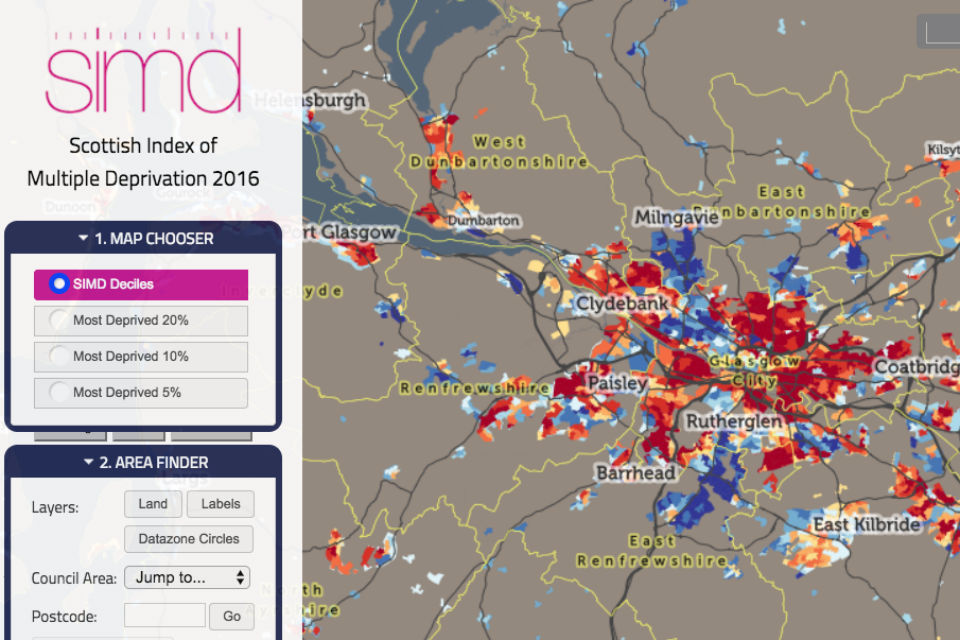
Like other UK indices of deprivation, SIMD uses statistics to compare socio-economic conditions and identify Scotland’s deprived places.
Traditionally, the index has been used by academics and the public sector to research the cause and effects of living in deprived areas and to inform and shape evidence-based policy-making. But the Scottish Government’s drive to make our data more open and accessible, meant more people were discovering the SIMD and wanted to use it.
So the SIMD team decided to engage directly with users of their statistics – and acted upon what they heard.
People said the index made them feel stigmatised. So the team decided they needed to better describe the aims and purpose of the index and how it can be used to improve conditions in their communities.
Out went the 160-page report of tables and analysis, and in came easy-to-understand infographics and case studies written by community groups and social enterprises themselves.
Statistics are now presented in a simpler and more accessible way, so that data can be interpreted easily and applied for the benefit of the community group or neighbourhood.
The result? When SIMD 2016 was published, the new maps appeared in media reports, and the statistics even trended on Twitter.
SIMD has been on tour, delivering training to help community and third sector groups understand how to use the index to attract funding and improve services in their area. A quarterly newsletter is helping to tackle SIMD myths and misconceptions and raise awareness of how it can help support positive change.
The success of the project and hard work of the team has attracted a number of nominations for awards. But even more satisfying is the difference the new SIMD is making to communities. It is helping to attract funding, inform policy and public service delivery and change attitudes – people are feeling proud about their communities.
For example, the community-led Tullibody Healthy Living initiative, near Stirling, is using SIMD data to show the importance of improving the life chances of local young people. SIMD highlighted that health and education deprivation are the main socio-economic issues for the area. The project manager uses the data to inspire community-led solutions and strengthen the case for funds to support local action.
We’re sharing our experiences with other governments too. The team recently went to Northern Ireland to share lessons learnt and best practice with the NIMDM (Northern Ireland Multiple Deprivation Measure) team, who are publishing their index later this month. I hope others will learn from the work of the SIMD team and their example of the Scottish Government striving to be open and accessible.
If you’re interested in finding out more, you can see our SIMD mapping online, or email the SIMD team and sign up to their newsletter.
1 comment
Comment by Jacqui Gavin posted on
What a fantastic way of looking at intersectionality!